![]()
![]()
|
|
|
Vibration measurements on Neracar
1. Introduction What causes imbalance, how to deal with it, the justification for a heavier new piston and the calculation of the starting value for this heavier piston is outside the scope of this discussion. Ben has elaborated these issues in http://www.geutskens.eu/neracar/description6.htm). Neither are the results of the measurements discussed here: emphasis is on the measurement process. 2. Vibration sensor
Assessment of vibration calls for more than touching the vehicle and estimating
the amplitude of vibration at a specific point of the structure: a sensor is
needed that provides an output proportional to the subjected vibration, allowing
for objective comparison of various configurations. It is common practice to use
accelerometers for such purposes. Accelerometers are available in an abundance
of sizes, ranges and qualities, however:
We have opted for the ADXL203 family from Analog Devices, with the following
characteristics: Based on figures provided by Ben as to maximum RPM and relevant engine geometry it was estimated that maximum values due to imbalance would not exceed 0.3 g. Thus the choice for a sensor with a measurement range of +/- 1.7 g seemed the obvious one. This sensor features a sensitivity of 1000mV/g.
The Neracar engine will not exceed 500 RPM. This corresponds with a frequency of
8.3 Hz. From the datasheet of the ADXL203 it can be deduced that with an
external capacitor of 0.22 μF higher frequencies are effectively blocked.
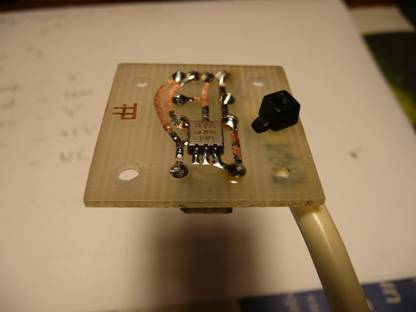
Sensor and capacitors have been mounted on a PC board of 30 x 30 mm. The sensor is mounted on the copper side of the print, the capacitors are mounted on the other side, as is the cable that connects the print to the 5V power supply for the sensor and the dual channel oscilloscope.
3.
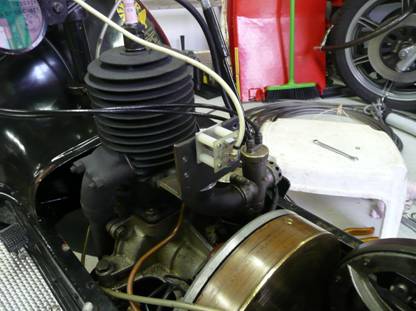
Measurement set-up
4. The first test
results
What spoiled the feeling of satisfaction was that two anomalies were observed
for which no explanation was available:
5.
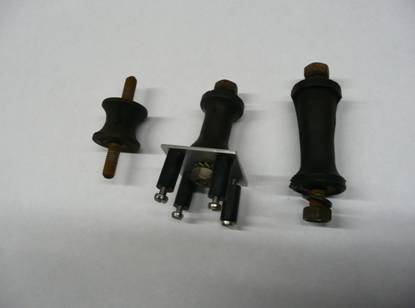
Analysis With the switch in the ‘high’ position, the presence of higher frequencies was confirmed: operating the foot starter already showed an abundance of vibration signals had had been invisible earlier. With the engine running the amplitudes of the higher frequencies increased to a level where, for both X- and Y-signal, clipping appeared. In a simulation program the presence of high-level vibrations in a frequency range far above the frequency of interest has been investigated. This exercise provided numerical proof that, due to clipping effects induced by the disturbing vibrations, considerable measuring errors are introduced for the low-level low frequency signals we are interested in. A quick attempt has been made to suppress the disturbing high frequencies by applying a mechanical filter. The underlying idea was to isolate the sensor print for high frequency vibrations through the application of a low pass mass-spring system: a vibration damper. Available types were from the automotive field. Though the transmission of the higher frequencies was indeed suppressed noticeably, uncontrolled movements in the frequency range of interest necessitated to drop this quick and dirty solution. What remained was to face facts: the selected sensor was not appropriate for the application at hand. A sensor was needed that could withstand the disturbing vibrations without clipping.
6. Second attempt The test results for the AD22037 looked fine: with the switch in the ‘high’ position no longer clipping effects due tot the disturbing higher frequencies, with the switch in the ‘low’ position a normal response to tapping of the sensor. The fact that the (10 times) wider measuring range of the AD22037 had to be paid by a proportionally lower sensitivity – merely 100 mV/g instead of 1000 mV/g for the original ADXL203 – could easily be compensated through adjustment of the settings of the scope.
Rob Poestkoke 3-3-2015 |